Grapl - A Graph Platform For Detection and Response
(This blog post is transcribed from a conference talk) (Original slides)
Github: https://github.com/insanitybit/grapl
Twitter: https://twitter.com/InsanityBit
Grapl is an open source platform for Detection and Response (D&R). The position that Grapl takes is that Graphs provide a more natural experience than raw logs for many common D&R use cases.
A graph is a data structure - like a linked list, or a hashmap. Graphs are composed of “nodes” and “edges” - nodes are usually analogous to “entities” and edges denote the relationships between nodes.

Graphs are a very powerful data structure. Even with a visualization of a graph that has no properties, as above, or labels - we can derive information; I can see, for example, the purple node has a relationship with the other two nodes.
The ability to encode relationships into their structure is one of the features of graphs that makes them so appealing for so many workloads.
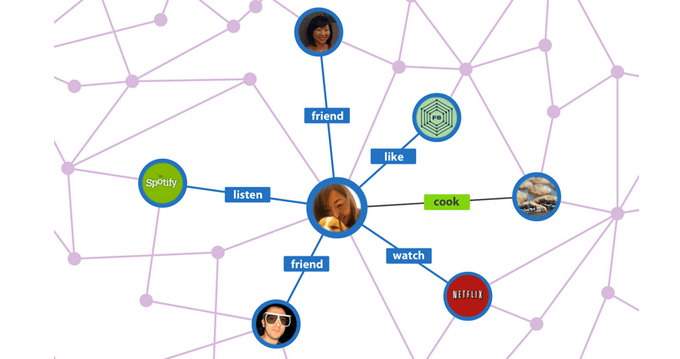
Companies like Facebook are all about relationships - that’s the basis of social media, after all. If Facebook wanted to target a given user for some ad, they can leverage graphs to do so by looking at what a users’ relationships are. A user may have liked a post, or opened an app - or you can look at their friends and their behaviors, building up a model for what this user may be in the market for.
Graphs have become :
“The Graph API is the primary way for apps to read and write to the Facebook social graph. All of our SDKs and products interact with the Graph API in some way, and our other APIs are extensions of the Graph API, so understanding how the Graph API works is crucial.
Google is another company that has invested considerably in graphs. Google’s Knowledge Graph is what allows them to move past a plaintext search - they encode semantic information into their graph, allowing you to make a search for a term like “Apple Location” and get results relating to Cupertino, even for pages that don’t have the word “Apple” in them.

TensorFlow, another Google project, is built using Dataflow Programming - a way to compile programs into graphs. TensorFlow’s claim to fame was its victory against the top Go board game champions, something that many thought was decades off.

Graphs in Security Graph based approaches have started to gain traction in the security space. John Lambert, a Distinguished Engineer at Microsoft, stated:

https://twitter.com/johnlatwc/status/1059841882086232065
As Lambert expresses in his post, Defenders tend to work with lists of information - lists of assets, possibly with labels such as criticality. Attackers, on the other hand, work with graphs - they land on a box and start traversing the network. The inability of lists to properly express relationships makes it hard to map the defender’s tools to the attacker’s approach. A list-based defender may think to locally about an asset, not understanding the scope of the trust relationships within their network.
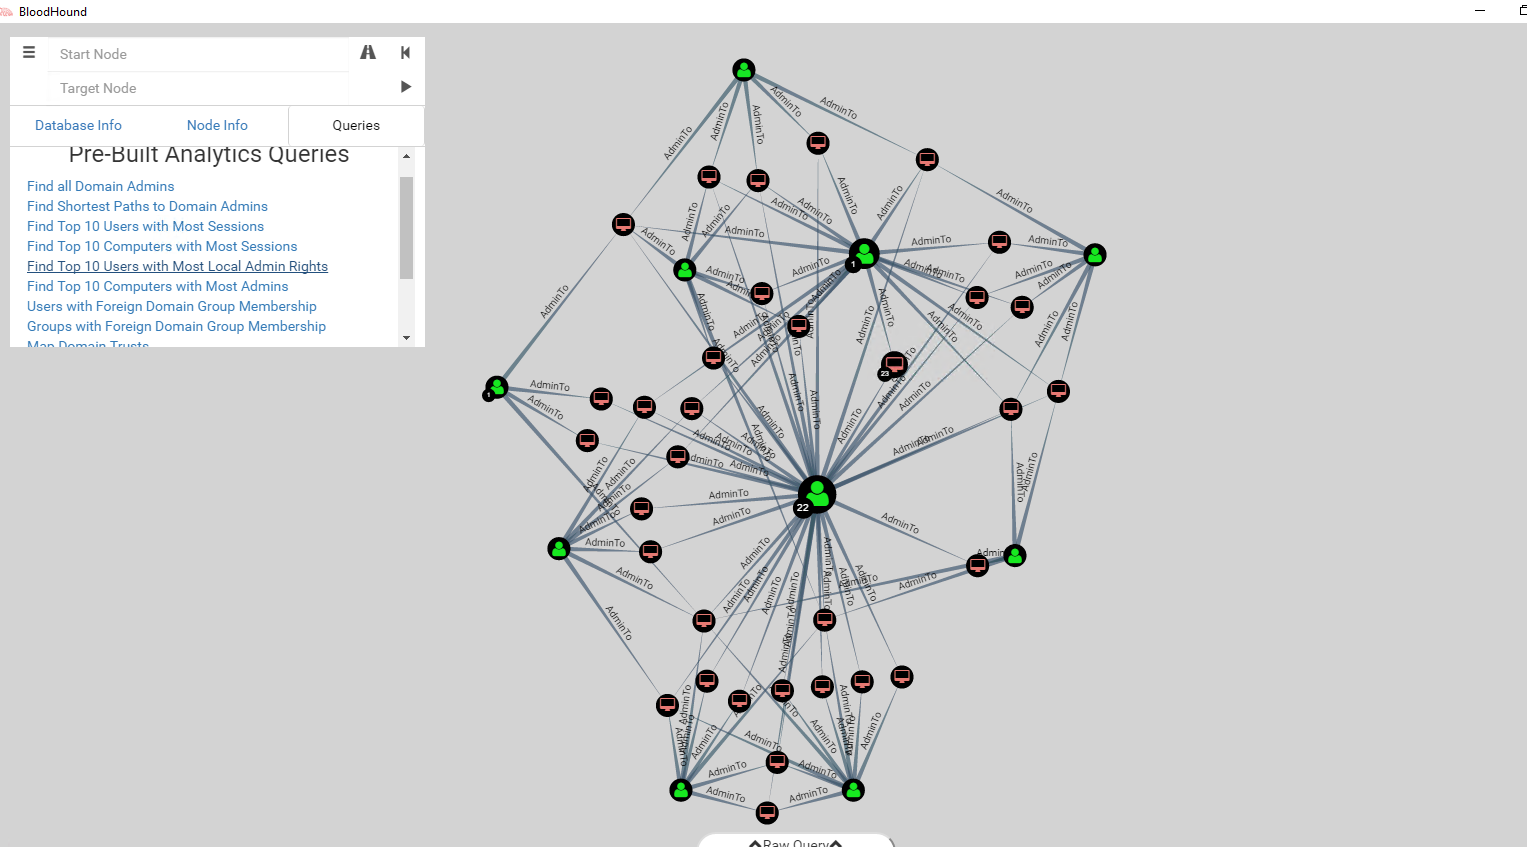
The tool BloodHound uses a graph-based approach to demonstrate implicit trust relationships within Active Directory. They even package custom graph algorithms to help you determine attack routes that you should be prioritizing - such as the ‘Shortest Path To Domain Admins’ query.
Graph based thinking can go well beyond assets and users.
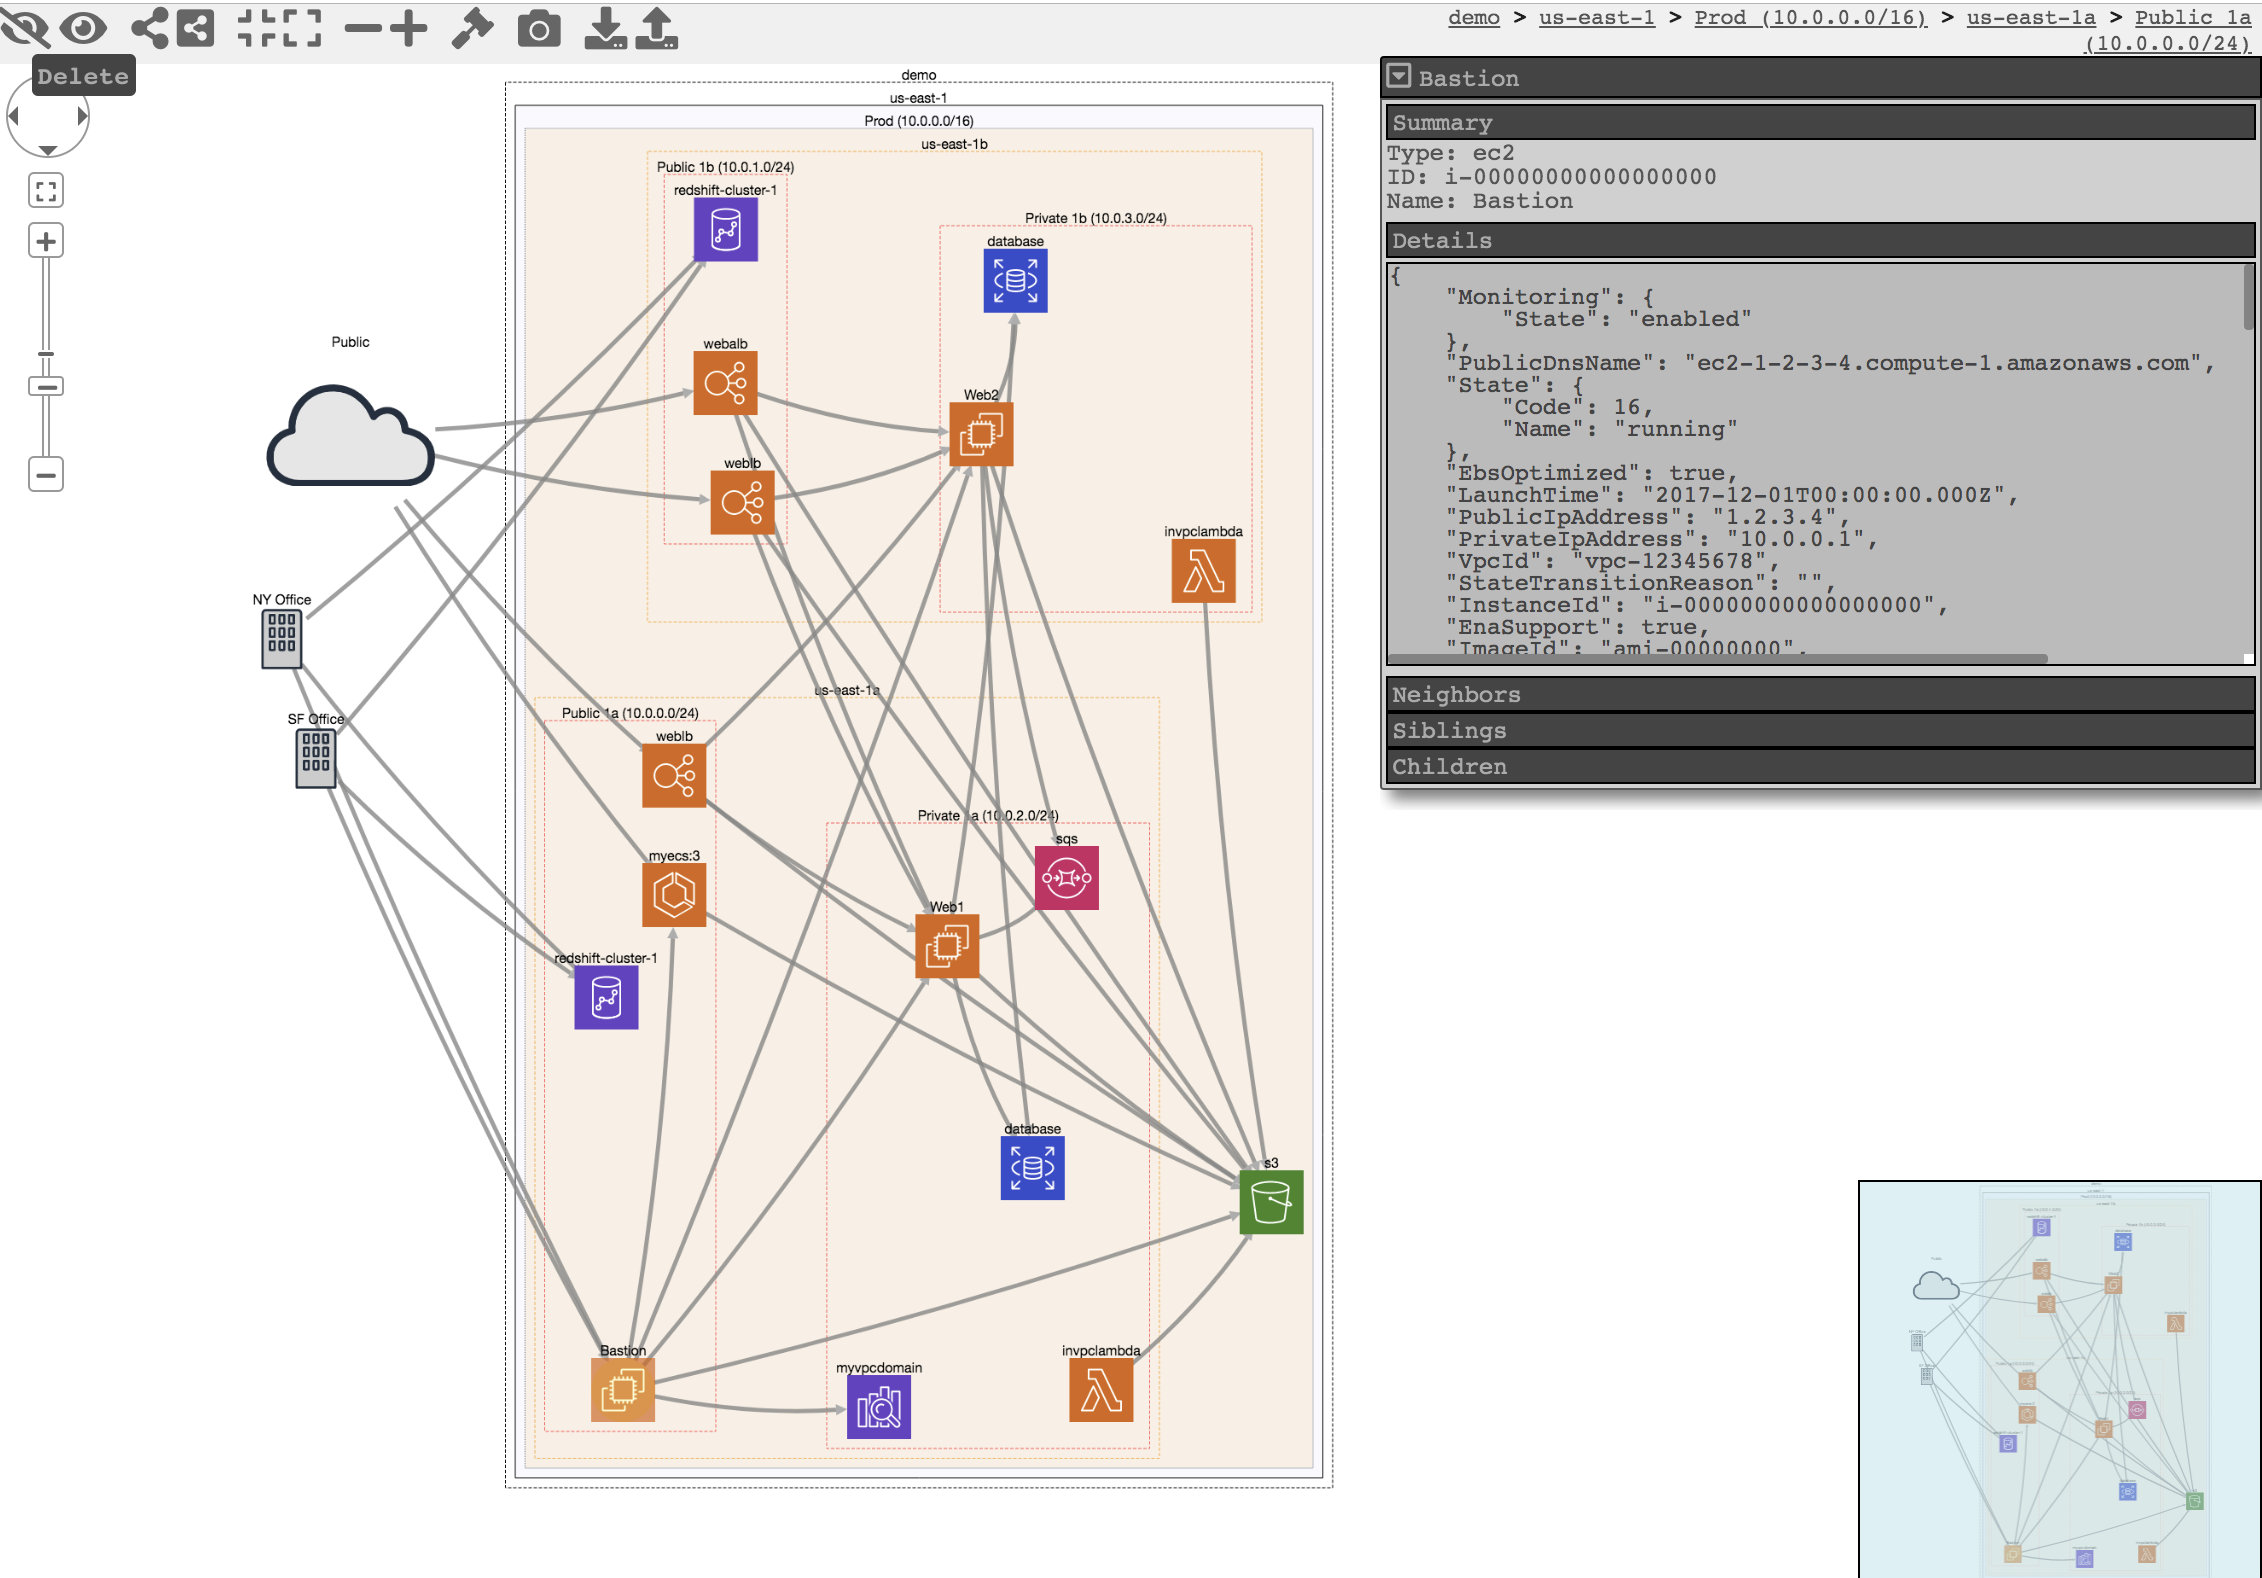
CloudMapper is a tool for exploring trust relationships in AWS environments, primarily for determining potential holes in policies.
Graphs for D&R The graph based approach has shown to be an effective, natural fit for a diverse problem space, and there’s a great case to be made that it fits well with Detection and Response work.
The core primitive for D&R is currently the log and we index massive lists of logs. Then, we write alerts based on logs in our environments and and combing through them line by line, attempting to pivot off of the data we find.
A list of logs might show:

Looking at these logs we can see that they are connected - thought it may not be immediately obvious. The pid and ppid fields match them up, and in such a small window of time we can probably rule out pid collisions.
Implicit within this set of logs is a graph.

When these logs are structured as graphs the relationships are impossible to miss - it’s pretty easy to look at the graph and understand what’s going on.
Grapl Grapl aims to provide exactly this sort of graph abstraction, designed specifically for D&R. Grapl will take security relevant logs and convert them into graphs, forming a giant ‘Master Graph’ representing the actions across your environments. This Master Graph lives in DGraph, which provides us a language for querying the data.

Grapl is an attempt to explore Detection and Response given a graph primitive instead of a log primitive. It works by taking logs that you send it (currently supporting Sysmon and a custom JSON format) and parsing those logs out into a subgraph representation.
Grapl then determines the ‘identity’ for each node (eg: “we have a pid, we have a timestamp, what’s the ID for this process node”).
Using this identity Grapl can then pin up this subgraph into the master graph. This master graph will represent all of the relationships across your environment.
Analyzers, the ‘attacker signatures’ for Grapl, are then executed against the graph. These analyzers can query the master graph for suspicious patterns.
When these analyzers find a sketchy subgraph Grapl will generate an Engagement - this is where your investigation will begin.
Identity
By joining data together semantically it becomes possible to easily reason about non-local attributes of your data. A log for a process event tells you only one piece of information whereas a Process Node with an identity can tell you about the history of a process, and its behavior over time. It can take multiple logs to describe a process starting, reading a file, making a connection, and terminating, but we can represent that data far more effectively as a single node.
Nodes in a graph can also provide identity, which is a very powerful construct. With logs you have information about entities spread across many places - identity allows looking up all of the information for an entity in one place, its node.

Grapl identifies nodes by creating a timeline of state changing events. A creation event, such as a process creation, will mark the beginning of a new “session”. If we have logs come in that have “seen” a pid, we’ll go to that pid’s session timeline and find the process creation event that is closest before the “seen” time.

In some cases, such as for processes that start up very early or for static files, we may not have creation events. In this case we have to guess at what the process ID is.

Guesses will also have to propagate. The algorithm has room for improvements but my experience is that it tends to guess things correctly.
Grapl will also assume that if two of the same pid are seen within a small window of time that they are the same, and won’t look over the entire timeline of sessions to figure it out - this should match reality pretty well, pid collisions don’t occur too often.

Analyzers
Logs generally describe an action, and some properties of that action. In some cases, with really powerful logging solutions like Sysmon, we can get a few relationships as well - such as a parent process ID.
Logs, especially logs from Sysmon, can power a lot of great alerts.

Not every log is like Sysmon though - the relationships are often implicit. And while Sysmon may pull some relationships in, it’s only ever one layer.
With the average log the relationships are only ever implicit. This can lead to thinking about actions in isolation, and not as part of a chain of events, or a sum of properties that may be spread across many logs.
Looking at the following logs in isolation, it may not be obvious that this is malicious behavior. Word spawning is benign, and powershell spawning is also often benign - certainly you could not write an alert on these logs alone in most environments.

When we pull out these relationships to form a graph the behavior is much more obviously malicious. We can move from writing an alert against properties, or individual events, and start writing alerts on behaviors and relationships.

When we view our system as a graph, attacker signatures are obvious. Observing non-local properties of a process or file becomes much simpler with a graph.

Alerts in Grapl are simply Python files. This provides maximum flexibility for alerts - you aren’t constrained by a DSL or query language. If you want to run multiple queries to express your alert, with intermediary logic, Python makes it trivial.
Python is also the language of choice for data scientists, which means the library ecosystem for working with data is best in class. With Python it’s possible to integrate other APIs or database queries into your alerts.
def signature_graph() -> str:
    child = Process() \
        .with_image_name(contains="svchost.exe") \
        .with_node_key(eq='$a')

    parent = Process() \
        .with_image_name(contains=Not("services.exe"))
    return parent.with_child(child).to_query()


def _analyzer(client: DgraphClient, graph: Subgraph, sender: Connection):
    for node_key in graph.subgraph.nodes:
        res = client.query(signature_graph(), variables={'$a': node_key})

        if not (res and res.json):
            print('res was empty')
            continue

        res = json.loads(res.json)

        if [sender.send(make_hit(match)) for match in res.get('q0', [])]:
            print('Got a hit for {}'.format(node_key))

    sender.send(ExecutionComplete())
One of the best parts about using Python for alert logic is the ability to write powerful tests. You can patch and mock, set up local infrastructure, write positive and negative tests, etc - all witrhin the stdlib. Python also has some powerful testing tools such as Hypothesis. Using Python should make it easy to integrate your tests into a Continuous Integration pipeline.
Writing correct alerts that age well can’t be undersold. Testing is a huge boon - but there’s also linters, style enforcement, code review, type annotations, and tons of other ways to ensure that no matter who’s modifying your alerts they still function correctly.

Investigations
When investigating an attacker using a log based approach there are some significant caveats.
Given a log that triggers an alert you’ll begin searching for fields related to that log, building up a timeline of attacker related events.
During our investigation we want to pivot off of relationships. We’ll start at the top layer - the initial alert, and use its fields as implicit joins. Pivoting off of the ‘pid’ and ‘ppid’ may yield some results.
We may also search for the hash - but these are all implicit relationships, not real ones, so we get nothing back (wasting time searching over all of our logs in the search window).
We may also search for the image_name - it would be great to know what created the suspicious file. Unfortunately, no results again.

Pivoting off of the image_name would be really nice, so we can extend our search window back further. This will slow searches down, but it can be necessary to get logs we need.
We’ve now pulled in some logs relating to image_name, but we also see a log relating to the pid - but it’s not the process we care about. In my experience, once you’re expanding your search window >12 hours you are extremely likely to run into a pid collision. So now we’ll have to deal with removing those logs as they are not relevant.
This log based workflow can be completely fine, especially for short investigations. When it comes to longer investigations the inability to understand your pivot points, the necessity to research over all of the timeline, and the lack of identity, can slow things down a lot.

Because the graph datastructure encodes relationships, which are our pivot points, directly into their structure, they solve a lot of these issues. When looking a at a process we don’t need to ‘search’ for what that process has done - we have all of that encompassed in the node and in its relationships.
We don’t have to wonder about our edges - whether we can pivot off of them or not is determined by their existence; if an edge exists, we can traverse it.
There’s no need to expand search windows - we don’t have to care about when a parent process did something, we can see what it has done in totality.

Grapl provides an Engagement construct for performing investigations - it’s a Python class that you can load up in an AWS hosted Jupyter Notebook.
Engagements are still very alpha, and the code below is not fully implemented.
When an Analyzer fires Grapl will store whatever subgraph it triggered on in the Engagement Graph - a separate graph database instance to hold engagements.on.
After instantiating a view of the Engagement in our Notebook we can start expanding the graph. Our pivot points are always observable and pivoting is efficient and trivial
An investigation is complete when you have a complete subgraph representation of attacker behavior. The notebook you’ve used will act as a record of your investigation - you can incorporate these into libraries or runbooks, and use them as training material for tabletops.
There’s no supported visual display for the engagement graphs right now, but my hope is to build a live updated visualization that can be displayed in a separate browser window. This would allow for a separate of your searches and the state of the engagement - I think this will make it easier for multiple people to work on an engagement in the future.
In the future, because engagements are themselves a graph, it should be possible to merge engagements together when they overlap. Or, otherwise, you could have temporary engagement graphs that don’t alert on their own, but only if a correlatoin thres

Grapl as a Platform I’ve described Grapl as a platform - what that means is that it isn’t a black box. Grapl is a collection of services hosted on AWS and libraries for integrating into them. Every single service that makes up Grapl works by emitting and receiving events.

All events are multiconsumer, so extending Grapl is as easy as subscribing to those events. If a parser for a new type of log format needs to be added it’s a matter of subscribing to publishes to the “raw-log” bucket, and then emit messages to the “unidentified-subgraph” bucket.

Building parsers for Grapl is best done in Rust. I built most of Grapl in Rust for a few reasons - the simplest is performance; Grapl has to be able to consume a lot of logs, and Rust is the ideal language for that task. It’s memory safe and it’s extremely efficient.
When building a parser the goal is to create a graph that represents the relationships between any entities described in the graph. Even if all you have is a parent process id, you can describe that as a node - Grapl will figure out exactly which node that pid is referring to, and link everything up.
We also have to provide the “state” of the node, for certain nodes like Process or Files, which can have transient states (“Created”, “Already exists”, “Terminated/Deleted”). This helps Grapl to identify the process.


Once the nodes have been parsed out they need to be linked up in a graph. And that’s it - a bit of boilerplate around event handling, and you have a subgraph parser.

Future
Grapl has gone from a white board drawing to being able to build full graphs of system activity from my lab environment, but I have a lot of future work planned.


One thing I haven’t built out for Grapl is a data management system. Grapl can store data very efficiently but theres no cleanup of old nodes. I intend to solve this problem soon, but it isn’t straightforward.

Grapl has solid support for Process and File nodes, and preliminary support for networking. I’m eager to get network support in as soon as possible in order to better capture lateral movement and C2. In the future I’d like to also explore modeling users and assets - I think this information is often important information during the triage phase, and it opens up some interesting analytics approaches like cohort analysis.

There are many research papers around graphs - even in the detection security space. One paper in particular is about an approach that was taken to detect components of what is described as a “Causal Graph” that are likely to be an attacker. Their tool, PRIOTRACKER, demonstrates an approach that expands a graph based on commonality features and to minimize fanout - ideally scoping exclusively attacker behavior.
This sort of approach is usually pretty expensive, even for a system like the one in the paper that is explicitly optimized for this work. I think this approach would actually be ideal as a way to automatically scope an engagement. When engagements are created the system could auto-scope the connected graph and by the time the Jupyter Notebook is opened a portion of the investigation could be complete.
When working with a powerful abstraction like a Graph there’s a lot of opportunity to implement more advanced techniques.

Grapl currently supports a custom JSON log format, as well as Sysmon logs. I think that between these two formats you can generally get most data up into Grapl, but I’d love to have native support for OSQuery or other open source logging solutions.
Grapl also has no native display, and relies on dgraph’s visualization, which isn’t tuned for engagements. Graphistry has beautiful display features and is designed with similar workflows in mind - an integration seems worth pursuing.

Setting up Grapl
Grapl is intended to be very easy to set up and operate. Almost all of Grapl is built on managed services, and can be set up using a single deploy script.
Clone grapl and install the aws cloud development kit:
$ npm i -g aws-cdk
$ git clone git@github.com:insanitybit/grapl.git
Create a .env file in the grapl-cdk folder with the following fields:
$ cd ./grapl/grapl-cdk/
$ <your editor> ./.env


HISTORY_DB_USERNAME=username
HISTORY_DB_PASSWORD=password
BUCKET_PREFIX="<unique bucket prefix>"
GRAPH_DB_KEY_NAME="<name of ssh key>"
Then it’s a single command to deploy:
./deploy_all.sh
Wait a few minutes and Grapl’s infrastructure and services will be deployed.
After Grapl’s core services are set up you can SSH using the SSH key as named in the .env file.
Then just follow the DGraph deploy steps here.
The deployment isn’t necessarily built for a production, scalable system, but it’s a base install that can provide a playground to work with Grapl.
blog comments powered by Disqus